Note: This page is best viewed on a larger screen; it may be difficult to read on a mobile device or tablet.
Use the lefthand tabs to navigate through a presentation by the VTSU Center for Teaching & Learning Innovation focused on collecting and analyzing direct measures of student learning for the purposes of continuous quality improvement and program assessment.
The CTLI also has information about how to collect and analyze indirect measures.
What Are the Two Types of Measures?
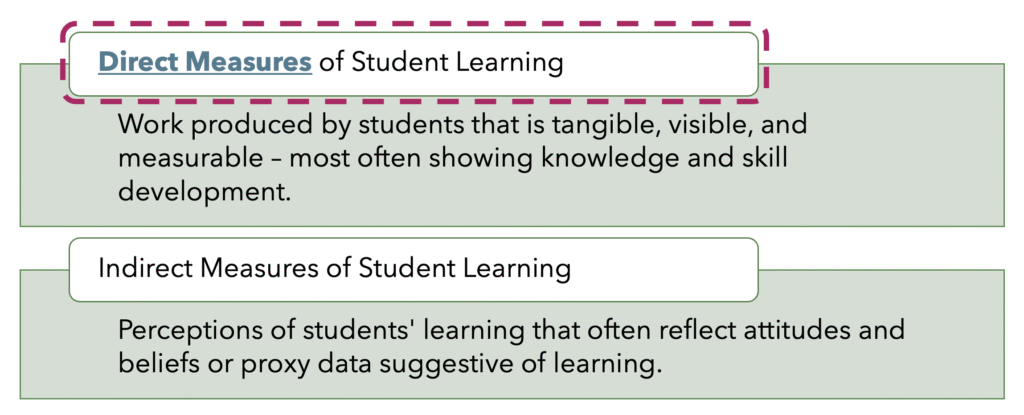
It is important to distinguish Direct Measures from Indirect Measures.
Direct measures encompass work produced by students that is tangible, visible, and measurable. Typically, direct measures demonstrate students’ learning related to knowledge and skills.
Indirect measures of student learning, which are not the focus of this workshop, reflect students’ perceptions of learning (such as through surveys or focus groups) or proxy data that might be suggestive of learning (such as distribution of grades or admission rates into graduate schools). Sometimes people wonder why grades aren’t a direct measure, and it’s because they reflect components beyond student learning, such as attendance and participation.
Examples of Direct Measures
Ideally, each Program Learning Outcome will be assessed with both direct and indirect measures.
Here are some examples of direct measures of student learning:
- Capstone projects and student portfolios evaluated using a rubric
- Research projects evaluated using a rubric
- Major papers evaluated using a rubric
- Juried performance evaluations
- Internship supervisor ratings of student performance
- Comprehensive examinations
- Pre- and post-test measures
- Proficiency exams
- Performance in licensure exams
- National or standardized exam scores
Direct measures of student learning may occur in a class (such as projects, papers, performances, exams), or they may result from an applied learning experience (such as an internship), or they may be an activity students engage in through an outside organization (such as a licensure exam).
Direct Measures Produced in Courses
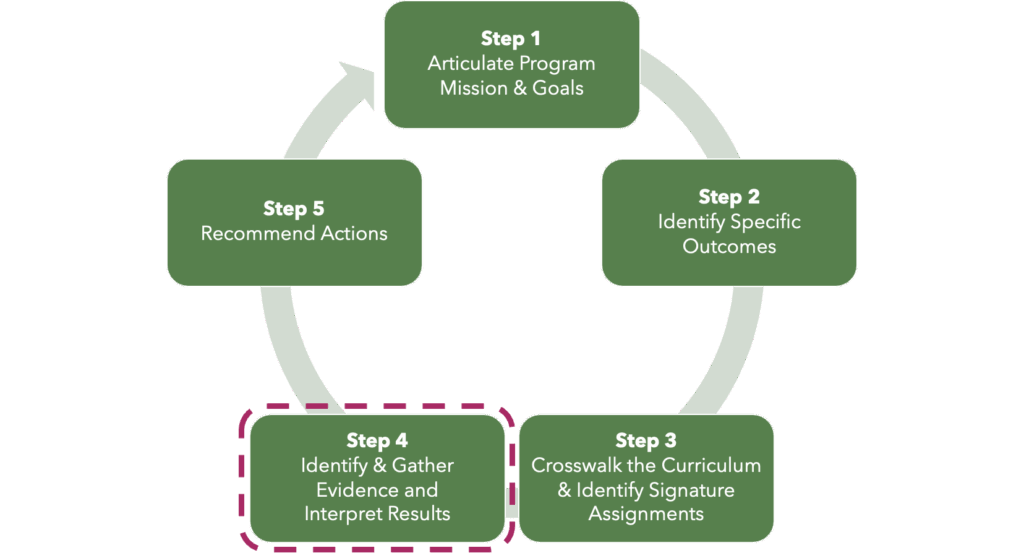
When direct measures are produced in courses, they are most effective when the instructor has considered Alignment. During Step 3 of the Continuous Improvement Cycle, individual courses were mapped to the Program Learning Outcomes (as part of the Curriculum and Learning Outcomes Crosswalk).
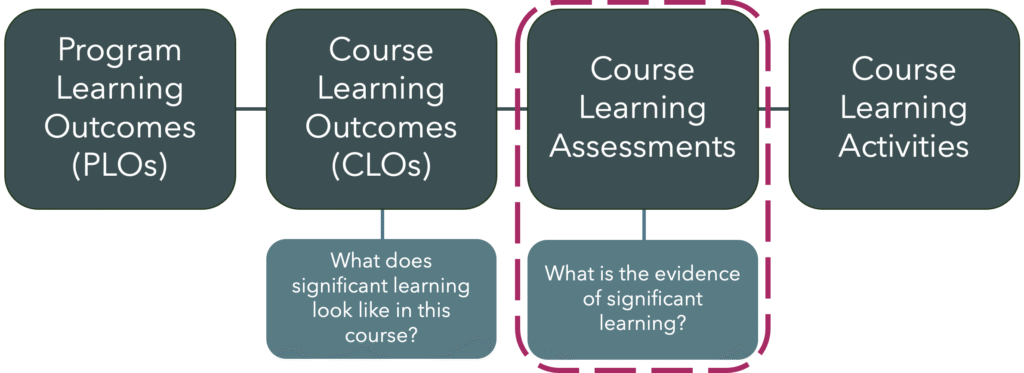
Instructors who teach in the program should write their Course Learning Outcomes to be intentionally aligned with relevant content and at the appropriate level of learning to achieve the desired student learning. One way to think about developing these is to ask the question, “What does significant learning look like in this course?” After crafting or revising the Course Learning Outcomes, the next step is to design Course Learning Assessments that allow students to demonstrate proficiency with the Course Learning Outcomes. This can be done by asking, “What is the evidence of significant learning.” Then Course Learning Activities and Materials are directly tied to the Assessments. Alignment weaves a thread from the Program Learning Outcomes all the way through to the Course Learning Activities and Materials.
Which Assessment is Better Aligned?
Let’s take a look at an example. We have an Outcome on the left and two possible Assessments on the right.
Outcome
Students will be able to formulate a hypothesis to explain a blackout during a written exam, based on scientific evidence of human memory.
Assessment Options
An essay exam requiring application of theoretical concepts to a practical problem.
A fact-oriented test with fill-in-the-blank, multiple choice, and short answer questions.
Which assessment is better aligned with the outcome and why?
Aligned Assessment Increases Learning
The essay exam, in this case, is better aligned. Formulating a hypothesis requires not just an understanding of, but the ability to integrate and express the theoretical underpinnings of, a concept. When students are asked to apply learning to a problem, they also will elaborate to consider contextual factors.
Outcome
Students will be able to formulate a hypothesis to explain a blackout during a written exam, based on scientific evidence of human memory.
Assessment Options
An essay exam requiring application of theoretical concepts to a practical problem.
A fact-oriented test with fill-in-the-blank, multiple choice, and short answer questions
Impacts on Learning
More effective learning strategies (elaboration, integration), increased motivation, deeper learning.
Less effective learning strategies (review), lower motivation, shallower learning.
Reference:
Leber, J., Renkl, A., Nückles, M., & Wäschle, K. (2018) When the type of assessment counteracts teaching for understanding. Learning: Research and Practice, 4(2), 161-179, DOI: 10.1080/23735082.2017.1285422
Signature Assignments for Direct Evidence of Learning
We hear the phrase Signature Assignments related to Program Assessment frequently.
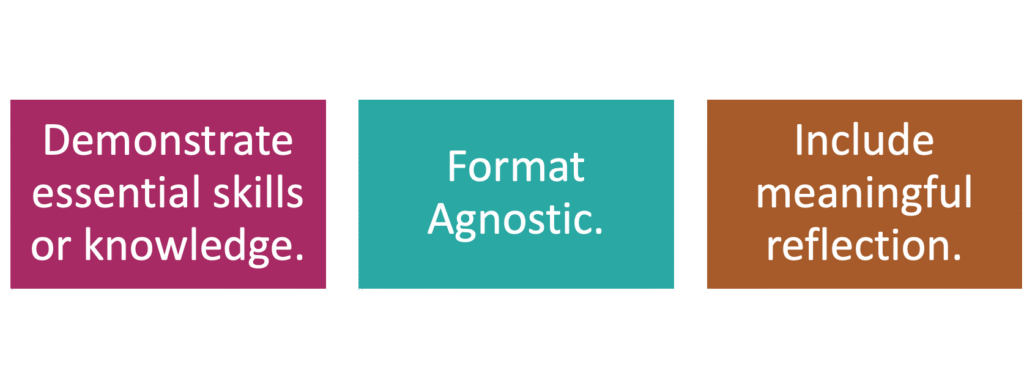
Signature Assignments are Course Level Assessments that are aligned with Program Learning Outcomes and include a reflective component, engaging students in metacognitive analysis of their learning against the related Course Learning Outcome (which provides both direct and indirect measures).
Sometimes Signature Assignments are standardized across sections of a course; other times, Signature Assignments are tailored by the instructor to their particular section.
A single Signature Assignment may address multiple Course Learning Outcomes or it may address a single one.
The Goals of Assessment
When planning assessment activities and considering what evidence to use, it is important to understand your goals.
Ultimately, the program assessment process is driving at answering two fundamental questions:
- Did students learn or become proficient in X? (Did learning occur?)
- To what degree did students learn or become proficient in X? (How well did learning occur?)
Are There Additional Questions to Answer?
Programs may also have additional specific questions, perhaps relevant to a particular Program Learning Outcome or to the progression of students through a series of courses.
Examples:
- Which students did better on PLO2, and why?
- What effect did the recent curriculum change have on student achievement for PLO7?
- Which knowledge and skills are students not successfully transferring from Course X into Course Y, and why?
- Did students taking the prerequisite course first actually do better in Course X on PLOs 4 and 5 than those who tested directly into it?
Selecting a Sample Size
It is important to understand how your sample size influences the validity of your data. It is best to set a goal of a ± 5% margin of error and a 90% or 95% confidence interval when selecting the needed sample size. For example, if you have a 90% confidence interval with an error level of 5%, you are saying that if you were to conduct the same assessment 100 times, the results would be within ± 5% of true population value 90 times out of 100.
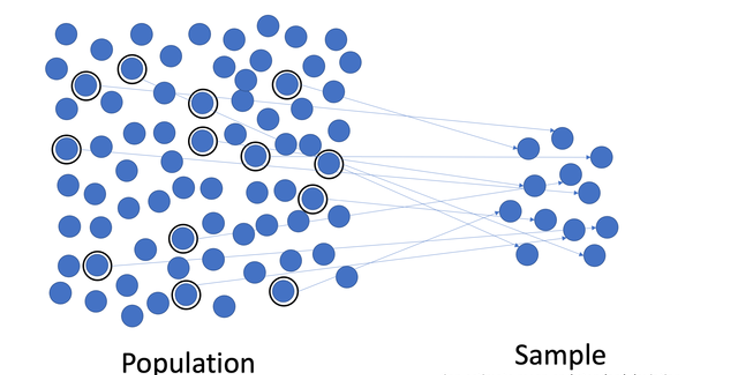
- Aim for a ± 5% margin of error and a 90% or 95% confidence interval when calculating the needed sample size
- A simple random sample can be developed using a number generator or use the chart on the next slide
- Ensure demographic representation of the student population on key measures such as first-generation status, Pell-eligibility, gender, and race.
Representative sampling should also be considered, if a random sample is unlikely to be inclusive of various key demographics.
If you need help calculating a sample size beyond the population size examples on the next page, contact the CTLI for assistance (ctli@vermontstate.edu).
Sample Sizes for Various Population Sizes
The sample size calculations here pertain to clean, useable data from your assessment work. When planning, it is recommended that you include a few additional students or papers, so that you will be able to deal with incomplete data and unexpected situations (e.g., a student paper is missing pages, a rater skips a portion of the rubric, technology glitches, etc.).
Sample Size for a 90% Confidence Interval:
| Population Size | ± 15% Sampling Error | ± 10% Sampling Error | ± 5% Sampling Error |
|---|---|---|---|
| 25 | 14 | 18 | 23 |
| 50 | 19 | 29 | 42 |
| 100 | 23 | 40 | 73 |
| 200 | 26 | 51 | 115 |
| 400 | 28 | 58 | 162 |
Sample Size for a 95% Confidence Interval:
| Population Size | ± 15% Sampling Error | ± 10% Sampling Error | ± 5% Sampling Error |
|---|---|---|---|
| 25 | 16 | 20 | 23 |
| 50 | 23 | 33 | 44 |
| 100 | 30 | 49 | 79 |
| 200 | 35 | 65 | 132 |
| 400 | 39 | 77 | 196 |
Quantitative Methods for Collecting & Analyzing Direct Evidence
There are both quantitative and qualitative methods for analyzing direct evidence. Let’s investigate both options, recognizing that programs may choose a combination of both methods when engaging in program assessment, depending on the types of evidence of student learning being evaluated.
On this page, read about quantitative methods, and on the next page, read about qualitative methods.
Analytic Rubrics:
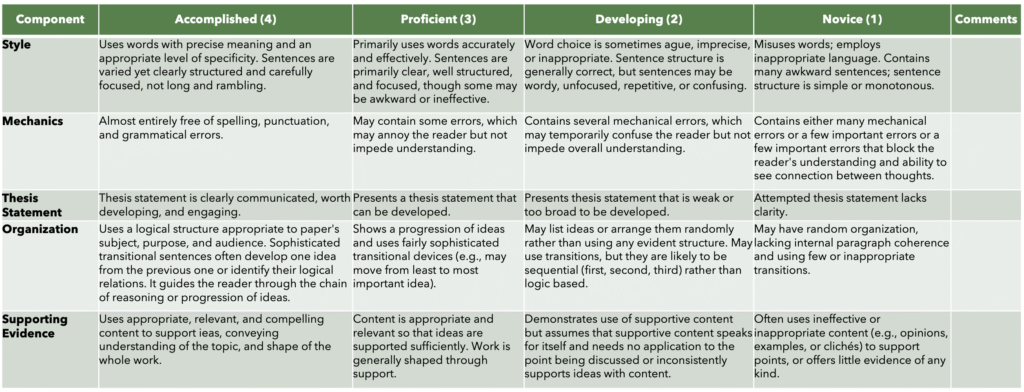
An analytic rubric is most the most commonly used and recommended method for analyzing direct evidence. An analytic rubric has categories and levels, with descriptive text for each component. Analytic rubrics developed from a Program Learning Outcome can be applied to artifacts of student learning from a variety of courses and a variety of assignments. For instance, if you expect to introduce a particular Program Learning Outcome in an introductory course, when you apply the rubric to student artifacts of learning from that course, you’d expect the rubric to reflect student learning in the “novice” and “developing” areas. When you apply that same rubric to an Intermediate-level class, if you notice that students haven’t moved beyond ”developing” into “proficient,” (perhaps the analysis shows an insignificant change from the introductory course), then you have found an area to make some changes. Or when you apply that same rubric to a Capstone where students are demonstrating mastery of that Program Learning Outcome, you find student learning reflects the “proficient” and “accomplished” areas, which is a validation of their growth. Analytic rubrics can be applied to a variety of artifacts of student work, including papers, projects, presentations, juried performances, portfolios, and more. Analytic rubrics can be applied to work produced by individual students, with the data aggregated and analyzed as a whole looking at frequencies, trends, and patterns.
Analytic rubrics (example, below) are the gold standard for quantitative assessment of direct measures. Sometimes an analytic rubric can be developed for two functions: grading and assessment. When this occurs, it is considered an “embedded assessment.” It is most common, however, for grading rubrics and assessment rubrics to be distinct, because grading is often tailored to the assignment with a different focus than program assessment.
Exam Result Analysis:
Completion scores are sometimes the only data programs have from certification/licensure/national exams. With evidence that one or more program outcomes are mapped to the exam, overall scores for completion can be one measure of student mastery of program learning outcomes. Comparisons can sometimes be made to peer institutions.
Accuracy scores can be used if students have taken an exam and questions are coded against the program outcomes or components of a program outcome. Evaluating the frequency of students who provided an accurate response on relevant questions compared with those who didn’t can be a quantitative approach to analyzing direct evidence. Not all questions will necessarily tie to Program Outcomes, so it is important to isolate the relevant questions.
Item analysis is also used with an exam, with questions mapped to outcomes. The questions may also be tagged by level of complexity (for instance, using Bloom’s taxonomy – remember, understand, apply, analyze, evaluate, create). Statistical analysis of student success with questions can reveal opportunities for greater emphasis in the curriculum. Not all questions will necessarily tie to Program Outcomes, so it is important to isolate the relevant questions.
Qualitative Methods for Collecting & Analyzing Direct Evidence
On this page, read about qualitative methods for collecting and analyzing direct evidence of student learning.
Qualitative Rubrics & Summaries
A qualitative rubric lists outcomes with a brief description of the highest level of performance for each outcomes with no ratings. Reviewers then comment on the student’s performance against the standard. While the individual rubrics can be returned to students as feedback, to be used for program assessment, the reviewer then creates an overall summary and analysis of the comments provided to students in the class, along with any observations or conclusions the instructor is drawing from them.
Coded Document Review & Themes
Documents created by students (such as projects or portfolios) can be coded, using pre-set or or inductively generated lists of recurring themes. Software such as NVivo facilitates this process. However, tagging documents in Word (with comments) and tracking details in Excel is also acceptable. Analyzing the whole set of data is important to identify patterns and broader categories. Analysis should be captured in descriptive summaries by the reviewer(s). Be careful when interpreting counts of comments, as frequency may not equate to importance. Tables can be used to show connections between themes within categories.
Strengths & Weaknesses Trait Analyses
Trait analysis is another approach to analyzing student work. The reviewer makes a list of traits, for each student, as strengths and weaknesses related to a program learning outcome. The list is then analyzed for successes and opportunities related to student achievement of that outcome. The trait lists and conclusions are submitted as assessment data.
Observation Notes & Summaries
For an outcome related to students working with others (such as teamwork or client interactions), observation notes may be the most effective approach to gathering assessment data. A reviewer (often the instructor) deliberately and systematically observes each student or student group, taking detailed notes about behaviors, attitudes, and evidence of applied knowledge. A summary and analysis of these observations noting apparent successes or concerns is written and submitted as assessment data.
About Benchmarks & Targets
When engaging in assessment there are two measures of success to be mindful of.
Benchmarks
Benchmarks allow us to evaluate student success. The benchmark is the minimally accepted level of learning (e.g., a 4 on the rubric, or 85 out of 100 on the national exam).
Example rubric levels:
- 1= Not present
- 2= Beginning competency
- 3= Developing competency
- 4= Advanced competency
- 5= Expert competency
Targets
The target allows us to assess the program’s success. The Target is the percent achieving the benchmark (e.g., 80% of seniors or 92% of graduates).
Faculty may choose to set a distinct benchmark or target for each of the different Learning Outcomes in the program.
Setting Benchmarks
When setting benchmarks, there are a variety of variables to consider. This is an opportunity for robust conversation amongst program faculty. For this round of assessment, work together to determine a reasonable benchmark (err on the side of relatively high).
Considerations for setting benchmarks (Suskie, 2018):
- Ask: What would not embarrass you?
- Ask: How will the assessment data be used (and by what audiences)?
- Ask: What are the relative risks of setting the bar too high or too low?
- When in doubt, set the standard relatively high rather than relatively low.
- If you can, use external sources to help set standards (disciplinary organizations, professional licensing requirements, etc.).
- Consider the assignment being assessed.
- Consider a sample of student work and past experience.
Reference:
Suskie, L. A. (2018). Assessing student learning : A common sense guide (3rd ed.). Jossey-Bass.
Ensuring Reliability & Consistency with Rubrics
Because analytic rubrics are the most common method of assessing evidence of student work, it is important they the rubrics are being interpreted and used consistently by reviewers.
To develop reliability, programs should engage in a rubric norming/training process, following one of two options before reviewers begin applying rubrics for assessment.
Ensuring Interrater Reliability
Option 1:
- Raters score student work independently
- Discuss similarities and differences
- Score again, and discuss again (if differences persist)
- Repeat process until consistency is achieved
Option 2:
- Raters score work that represents a wide range of student performance
- Raters agree on at least 2 samples that exemplify each performance level on the rubric
- These “anchor” samples are used as reference points and to train future raters
Ensuring Validity When Using Rubrics
All student names and identifying information should be removed before the assessment process begins.
Validity is ensured when more than one reviewer applies the rubric to each artifact of student learning. A mean of the two scores can be utilized when the scores are the same or separated by 1 level. When scores are separated by 2 or more levels, a third rater should assess the work and the three scores should be averaged together.
Blind and Double Scoring
- Deidentify all student work.
- Have two raters for each artifact being assessed.
- When scores are closely normed (separated by 1 level), use the mean of the two.
- When scores are separated by 2 or more levels, involve a third rater and average the three together.
Analyzing Assessment Data
Once you have collected and scored evidence, you then need to engage in analysis of that data.
Descriptive Analysis:
Descriptive Analysis may be sufficient for drawing conclusions about student progress against the Program Learning Outcomes.
- Basic statistics can include measures of central tendency (mean, median, or mode), standard deviation, or percentages/percent distribution.
- Always compare the results to benchmarks and targets.
Otherwise, if you don’t have the statistical skills within your program, work with Institutional Research to determine if differences and comparisons have statistical significance. See more details on the next page.
Work with Institutional Research for In-Depth Statistical Analyses
VTSU’s Office of Institutional Research (IR) is available to support programs with in-depth statistical analyses. Please submit your request and data with at least 2 weeks advance notice. It may also be useful to consult with IR at the beginning of your data collection process for additional advice and planning.
Submit your request to Institutional Research with at least 2 weeks of advance notice
by sending an email to irene.irudayam@vermontstate.edu.
IR can assist with difference, pre/post, and repeated measures analyses:
| Type of Analysis | Interval/ Scale Data | Ordinal/ Ranked Data | Nominal/ Categorical Data |
|---|---|---|---|
| Descriptive | Mean, Standard Deviation | Median, Mode, Percent Distribution | Frequencies, Contingencies Table |
| Difference | T-Test, ANOVA | Mann-Whitney, Kruskal-Wallis | Fisher’s Exact Test, Chi-Squared Test |
| Pre-Post, Repeated Measures | Dependent Sample T-Test, Repeated Measures ANOVA | Wilcoxon T Test, Friedman Test | McNemar Test, Cochran’s Q |
Acting On & Documenting Findings
Collectively, program faculty should meet and discuss findings from the assessment of both direct and indirect evidence. The purpose of these conversations is to identify changes to curriculum, pedagogy, and practice that will positively improve student learning.
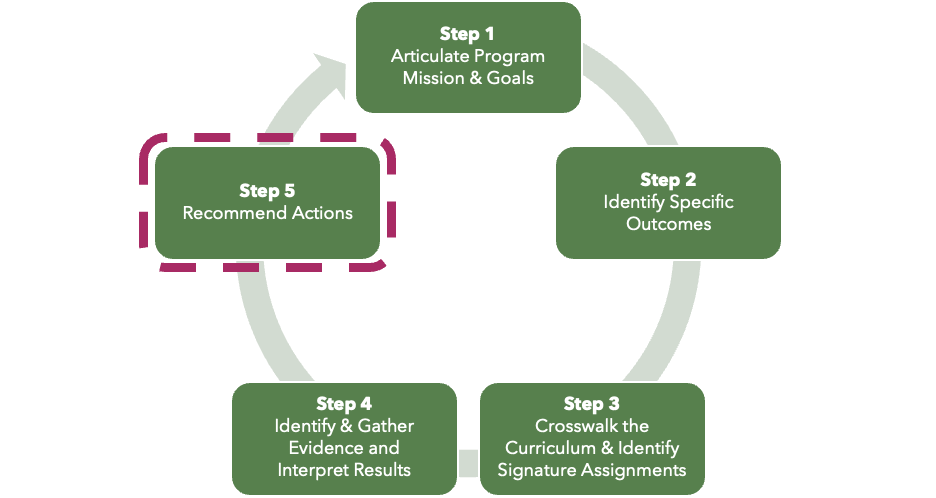
As part of Step 5 of the program assessment cycle, be sure to document the actions and changes that result from assessment activities:
- In Yrs 1, 2, 3, and 4 of the 5-year program review cycle, complete a Yearly Learning Outcome Assessment Report.
- In Yr 3, update the Program Outcomes Assessment Matrix.
- In Yr 5, complete the PReCIP Report, including the section labeled Continuous Improvement Plan.
Summary of Process
The preceding pages cover a lot of information. These are the 9 steps to take when working effectively with direct evidence.
- Identify the goal of assessment and any additional questions.
- Identify source(s) of direct evidence of student learning.
- Select a meaningful sample size.
- Choose a method for analyzing the direct evidence.
- Set benchmarks.
- As needed, ensure reliability through norming.
- Score/evaluate/summarize/code direct evidence, ensuring validity through blind and double scoring.
- Analyze assessment results.
- Identify actions to take.
Have Questions or Want Help?

This presentation has detailed notes to accompany each slide. It is meant to be a self-service resource for faculty engaging in Program Assessment at VTSU.
If you are overwhelmed by the information, have questions, or want additional help/clarification, the CTLI staff is here to support you.
Schedule a 30-minute consultation with us at your convenience.
References & Resources
There are significant resources available to learn more about direct measures and program assessment. You may find it useful to browse these sources that were used in the development of this presentation.
Andrews, A. (2019). A program assessment guide: Best practice for designing effective assessment plans. University of Wisconsin Milwaukee. https://uwm.edu/academicaffairs/wp-content/uploads/sites/32/2019/04/Guide.pdf
Core Curriculum Committee. (n.d.). CSU Core Curriculum Handbook. Cleveland State University. https://pressbooks.ulib.csuohio.edu/corecurriculum/
Leber, J., Renkl, A., Nückles, M., & Wäschle, K. (2018). When the type of assessment counteracts teaching for understanding. Learning: Research and Practice, 4(2), 161-179, DOI: 10.1080/23735082.2017.1285422
Massa, L. J., & Kasimatis, M. (2017). Meaningful and manageable program assessment : A how-to guide for higher education faculty. Routledge.
Office of Assessment for Curricular Effectiveness. (n.d.). Assessment data analysis. Washington State University. https://ace.wsu.edu/assessment-measures-and-data/assessment-data-analysis/
Office of Assessment for Curricular Effectiveness. (n.d.). Assessment measures and data. Washington State University. https://ace.wsu.edu/assessment-measures-and-data/
Office of Assessment for Curricular Effectiveness. (2020). Quick guide to sampling, sample size, and representation. Washington State University. https://ace.wsu.edu/documents/2015/03/sample-size-and-representation.pdf/
Suskie, L. A. (2018). Assessing student learning : A common sense guide (3rd ed.). Jossey-Bass.
University of Wisconsin-Milwaukee. (n.d.). Qualitative assessment strategies. https://uwm.edu/academicaffairs/wp-content/uploads/sites/32/2020/04/Qualitative-Assessment-Strategies.pdf