Note: This page is best viewed on a larger screen; it may be difficult to read on a mobile device or tablet.
Use the lefthand tabs to navigate through a presentation by the VTSU Center for Teaching & Learning Innovation focused on collecting and analyzing indirect measures of student learning for the purposes of continuous quality improvement and program assessment.
The CTLI also has information about how to collect and analyze direct measures.
What Are the Two Types of Measures?
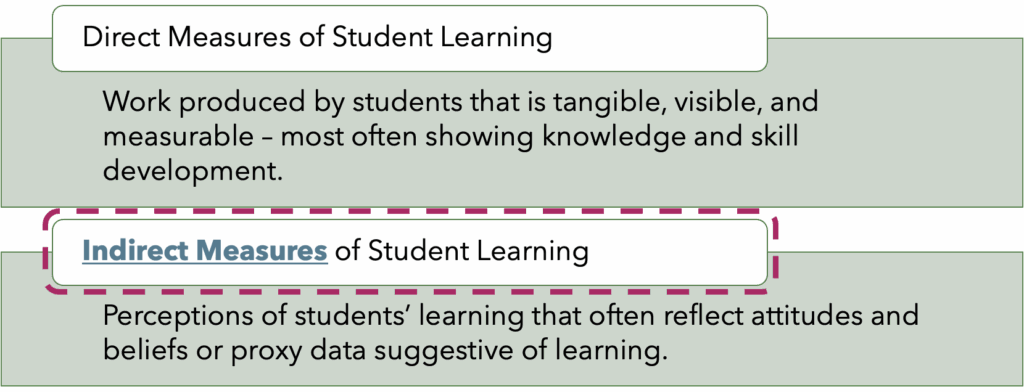
It is important to distinguish Direct Measures from Indirect Measures.
Direct measures, which are not the focus of this workshop, encompass work produced by students that is tangible, visible, and measurable. Typically, direct measures demonstrate students’ learning related to knowledge and skills.
Indirect measures of student learning reflect students’ perceptions of learning (such as through surveys or focus groups) or proxy data that might be suggestive of learning (such as distribution of grades or admission rates into graduate schools). Sometimes people wonder why grades aren’t a direct measure, and it’s because they reflect components beyond student learning, such as attendance and participation.
Examples of Indirect Measures
Ideally, each Program Learning Outcome will be assessed with both direct and indirect measures.
Here are some examples of indirect measures of student learning:
- Focus groups
- Locally and nationally-developed surveys (of current students, graduates, alums, employers)
- Modified student evaluations of teaching
- Interviews
- Student self-reflections and self-evaluations
- External accreditor feedback
- Faculty review of curriculum, syllabi, and assignment instructions
- Percent of class time spent on active learning
- Course grades
- Course evaluation questions not focused on the instructor
- Participation rates
- Placement and admissions data (employment in the field, graduate school acceptance)
- Honors, awards, and scholarships earned by graduates and alums
Indirect measures of student learning can help round out evidence collected through direct measures. For instance, you may find that students are overwhelmingly progressing in their learning after the intermediate-level courses typically taken in the sophomore year, and yet a significant fraction of students are leaving the program at this same point. Interviews or focus groups with these students who leave partway through completion of requirements may provide insights into the full student experience including their perspectives on the relevance of the learning they encountered up to that point in the program.
The Goals of Assessment
When planning assessment activities and considering what evidence to use, it is important to understand your goals.
Ultimately, the program assessment process is driving at answering two fundamental questions:
- Did students learn or become proficient in X? (Did learning occur?)
- To what degree did students learn or become proficient in X? (How well did learning occur?)
Are There Additional Questions to Answer?
Programs may also have additional specific questions, perhaps relevant to a particular Program Learning Outcome or to the progression of students through a series of courses.
Examples:
- Which students did better on PLO2, and why?
- What effect did the recent curriculum change have on student achievement for PLO7?
- Which knowledge and skills are students not successfully transferring from Course X into Course Y, and why?
- Did students taking the prerequisite course first actually do better in Course X on PLOs 4 and 5 than those who tested directly into it?
Uncover the How & Why
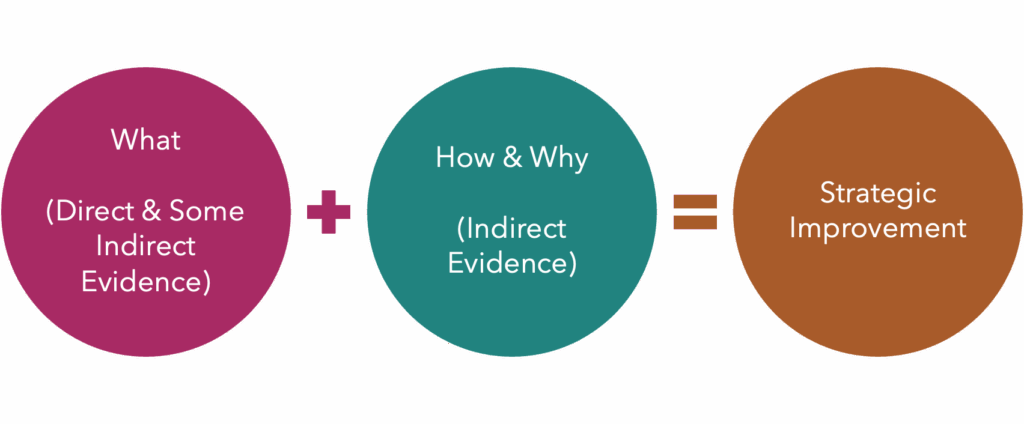
Indirect evidence can be used to provide insight into direct evidence.
For instance, let’s imagine your program has an outcome focused on research skills. Through your program assessment work, you discover that 60% of students are meeting a particular target, when, as a program, you’ve set the goal at 80%. What accounts for that 20% gap? If you used a rubric for the direct assessment for a capstone course that asks students to demonstrate research skills, you probably have a sense where students are meeting proficiency levels (such as with evaluating existing knowledge and theories) and where they are not meeting proficiency levels (such as with developing a research plan grounded in current knowledge gaps). But you might not understand why students are struggling with developing that research plan. After all, you know that this step is emphasized in both the introductory and intermediate courses in the major, providing scaffolding before the capstone course. Indirect measures can help answer this why and provide insight and direction for improvement.
Through one or more indirect measures (focus groups, interviews, survey) you might learn that students are struggling to come up with meaningful and unique research questions even when they understand the body of literature for a topic. As a result, their research projects tend to replicate existing findings versus explore new ideas. This indirect evidence provides greater direction in making adjustments to the curriculum to address this need.
Collecting Data with Surveys & Focus Groups
Depending on your needs, either a survey or a focus group may be more effective for collecting data, as outlined in the table below.
| Purposes | Survey | Focus Group |
|---|---|---|
| To understand what, how often, to what extent | X | |
| To understand how or why | X | |
| To get information from many people (100+) | X | |
| To test a new idea | X | |
| To get feedback on a new idea | X | |
| To contextualize survey findings | X |
When designing a survey, these suggestions may be helpful:
- Ensure student anonymity.
- Consider collecting demographic information such as campus, first-gen status, race, gender, etc. (as long as it would not jeopardize anonymity) in order to check for representative responses.
- Work with Institutional Research to validate survey questions and response rates.
When planning a focus group, you’ll want to follow this guidance:
- Identify the particular purpose (e.g., assessing the experience of the first student cohort in a new curriculum when they are mid-way through).
- Develop questions in advance, customized to target your programs assessment needs.
- Identify a neutral facilitator (e.g., someone who does not teach/advise in the program or have administrative power over the program).
- Ideally, plan for 75 minutes.
- Recruit an ideal-sized group, generally recommended to be 8-12 participants. Consider running multiple focus groups for larger sample sizes.
- Consider incentivizing student participation (food, stipend, school sweatshirt, etc.).
- Seek consent for recording the focus group.
- Ask students to not use identifying names when speaking during the focus group, to maintain semi-confidentiality.
- Do not record names in notes.
- De-identify the data in the transcript to maintain semi-confidentiality
- When appropriate, you may want to ask the neutral facilitator to hold the transcript and notes until after grades are submitted for a semester.
- Focus group results are often suggestive, rather than definitive, so it is best practice to combine these results with other sources of information and not base high stakes decisions solely on interpretations of focus group data.
Collecting Data with Modified Student Evaluations of Teaching
While course evaluations typically focus on evaluating instruction, questions can also be added that specifically collect indirect assessment data related to program learning outcomes. This data can be quantitative (Likert-type) or qualitative (open-ended text response). What’s most important is that they ask students to rate their confidence with a learning outcomes (quantitative) or specifically address or describe what they learned in relation to particular learning outcomes (qualitative).
Examples of Traditional Evaluation Questions
Likert-Type:
- The text and assigned readings were valuable.
- This class has increased my interest in this field of study.
- I am confident to do more advanced work in this subject.
Open-Ended:
- Please describe what you found to be most effective in the course.
Examples of Program Assessment Questions
Likert-Type:
- I am confident in my ability to analyze experimental results and draw reasonable conclusions from them.
- I am confident in my ability to apply professional ethical principles when making decisions.
Open Ended:
- Please describe what you learned about how to communicate effectively in interdisciplinary teams, both local and global.
Analyzing Qualitative Indirect Measures
Indirect evidence can be quantitative, but it is often qualitative (from interviews, surveys, focus groups, testimonials, student evaluations of teaching, etc). There are best practices to follow when analyzing qualitative data:
- Spend time reading through the data before engaging in granular analysis.
- Record your initial impressions, first, after becoming familiar with the data.
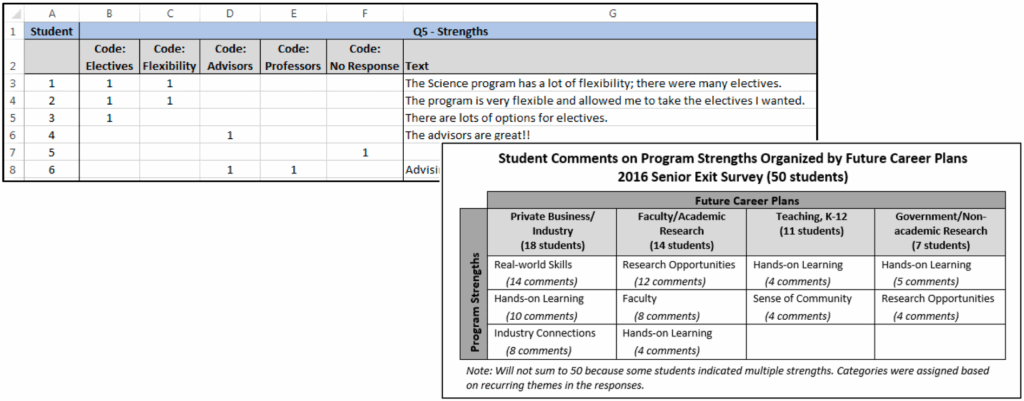
- While not always necessary, it is likely helpful to code the data for themes. You may have identified a few themes from your initial impressions, which are a good starting point. Additionally, allow themes to emerge as you dive deeper into the data. An Excel spreadsheet works well for this (see slide for an example).
- Be cognizant that frequency of comments/themes/categories may not always align with importance of ideas.
- Maintain a definition list for your themes.
- Re-arrange snippets of responses into categories.
- It can be helpful to create a table showing the relationship between categories and themes (see slide for an example).
- Write a summary of each theme with a representative quote from the data.
- Identify actionable items and questions to explore more deeply.
- A summary and analysis of this data would need to be prepared and submitted as assessment data.
Acting On & Documenting Findings
Collectively, program faculty should meet and discuss findings from the assessment of both direct and indirect evidence. The purpose of these conversations is to identify changes to curriculum, pedagogy, and practice that will positively improve student learning.
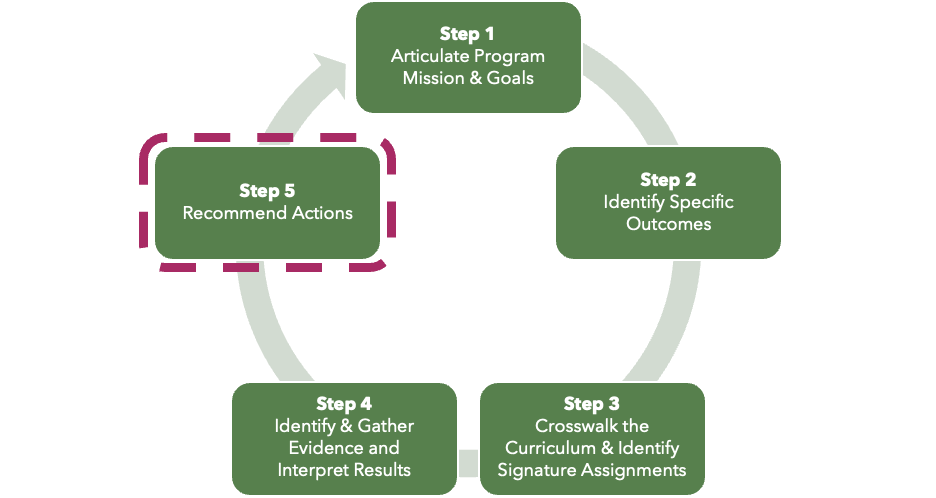
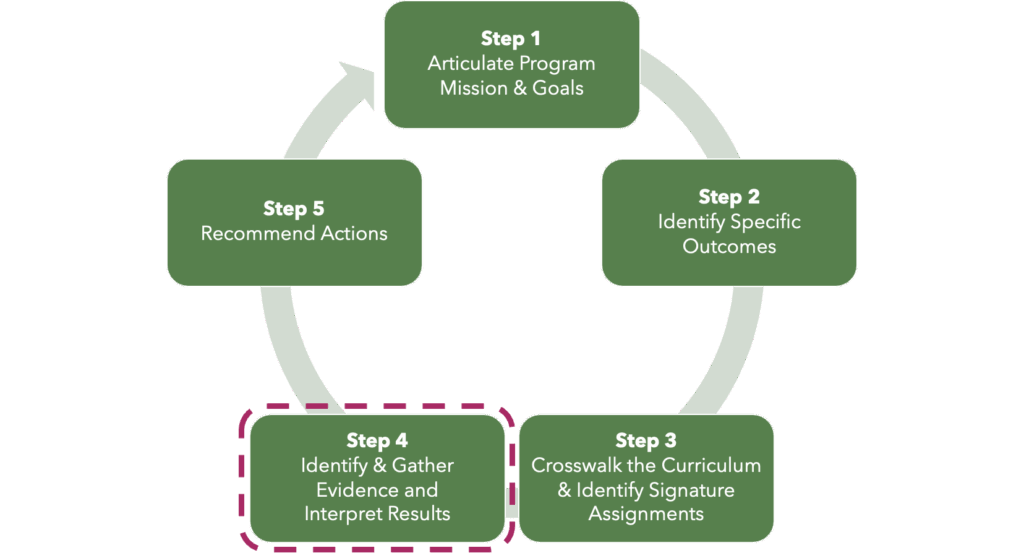
As part of Step 5 of the program assessment cycle, be sure to document the actions and changes that result from assessment activities:
- In Yrs 1, 2, 3, and 4 of the 5-year program review cycle, complete a Yearly Learning Outcome Assessment Report.
- In Yr 3, update the Program Outcomes Assessment Matrix.
- In Yr 5, complete the PReCIP Report, including the section labeled Continuous Improvement Plan.
Have Questions or Want Help?

This presentation has detailed notes to accompany each slide. It is meant to be a self-service resource for faculty engaging in Program Assessment at VTSU.
If you are overwhelmed by the information, have questions, or want additional help/clarification, the CTLI staff is here to support you.
Schedule a 30-minute consultation with us at your convenience.
References & Resources
There are significant resources available to learn more about direct measures and program assessment. You may find it useful to browse these sources that were used in the development of this presentation.
Andrews, A. (2019). A program assessment guide: Best practice for designing effective assessment plans. University of Wisconsin Milwaukee. https://uwm.edu/academicaffairs/wp-content/uploads/sites/32/2019/04/Guide.pdf
Massa, L. J., & Kasimatis, M. (2017). Meaningful and manageable program assessment : A how-to guide for higher education faculty. Routledge.
Office of Assessment for Curricular Effectiveness. (n.d.). Quick guide to analyzing qualitative (textual) assessment data. Washington State University. https://ace.wsu.edu/documents/2015/03/qualitative-data-analysis.pdf/
Office of Assessment for Curricular Effectiveness. (n.d.). Quick guide to focus groups for program assessment. Washington State University. https://ace.wsu.edu/documents/2015/03/focus-groups-quick-guide.pdf/
Office of Assessment for Curricular Effectiveness. (2020). Quick guide to sampling, sample size, and representation. Washington State University. https://ace.wsu.edu/documents/2015/03/sample-size-and-representation.pdf/
University of Wisconsin-Milwaukee. (n.d.). Qualitative assessment strategies. https://uwm.edu/academicaffairs/wp-content/uploads/sites/32/2020/04/Qualitative-Assessment-Strategies.pdf